Sunday, November 15, 2020

Strategy 6: Rising Wedge Pattern

 The rising wedge is a popular reversal pattern that is predictive in nature and can give traders a clue to the direction and distance of the next price move.

Rising wedges appear regularly in the financial markets and traders gravitate towards the pattern because of its simplicity in identification and application


WHAT IS A RISING WEDGE PATTERN?

The forex rising wedge (also known as the ascending wedge) pattern is a powerful consolidation price pattern formed when price is bound between two rising trend lines. It is considered a bearish chart formation which can indicate both reversal and continuation patterns – depending on location and trend bias. Regardless of where the rising wedge appears, traders should always maintain the guideline that this pattern is inherently bearish in nature (see image below).


HOW TO IDENTIFY A RISING WEDGE PATTERN

The rising wedge pattern is interpreted as both a bearish continuation and bearish reversal pattern which gives rise to some confusion in the identification of the pattern. Both scenarios contain a different set of observation dynamics which must be taken into consideration.

Continuation Pattern:

  1. Established downtrend
  2. Rising wedge consolidation formation
  3. Linking higher highs and lower lows using a trend line assembling towards a narrowing point
  4. Confirm divergence between price and volume using volume function - MACD may also be used
  5. Overbought signal can be confirmed by other technical tools like oscillators (RSI)
  6. Look for break below support for short entry

Reversal Pattern:

  1. Established uptrend
  2. Rising wedge consolidation formation
  3. Linking higher highs and lower lows using a trend line assembling towards a narrowing point
  4. Confirm divergence between price and volume using volume function - MACD may also be used
  5. Overbought signal can be confirmed by other technical tools like oscillators
  6. Look for break below support for short entry

HOW TO TRADE THE RISING WEDGE PATTERN

The chart above shows a rising wedge ‘continuation’ pattern after a determined downtrend. The rising wedge is outlined by the blue dashed lines showing diminishing bull strength in the uptrend. Confirmation of the uptrend waning in strength can be seen using the volume tool on the chart which depicts fading volume in concurrence with the ascending price in the market. This is known as divergence, showing that the upward movement is coming to an end.

The entry point (labelled) occurs once the trend support line of the rising wedge has been breached. There are two common methods of entry:

  1. Wait for a candle close below the support trend line before entry
  2. Enter into the short position as soon as the price breaks the support line, regardless of the candle close
The stop level as highlighted on the chart is elected from the high point of the rising wedge located on the resistance trend line. This identification point makes it relatively simple to locate the stop level for novice traders. The limit in this example was taken from the previous swing low giving this trade an extremely positive risk-reward ratio.


Strategy 5: HEAD AND SHOULDERS PATTERN


key action points when identifying this pattern:

  1. Identify the overall market trend using price action and technical indicators (preceding uptrend)
  2. Isolate the Head and Shoulders chart construction
  3. The distance between the ‘Head’ and ‘Shoulders’ should be as close to equidistant as possible
  4. Delineate the neckline at the low point between both ‘shoulders’ – preferably horizontal but not obligatory


The Head and Shoulders chart pattern is a price reversal pattern that helps traders identify when a reversal may be underway after a trend has exhausted itself. This reversal signals the end of an uptrend. The Head and Shoulders pattern has a distinctive appearance resembling its namesake which includes a distinct ‘left shoulder’, ‘head’, ‘right shoulder’ and ‘neckline’ formation.


WHAT IS THE INVERSE HEAD AND SHOULDERS PATTERN?

The Inverse Head and Shoulders (informally known as the 'Reverse Head and Shoulders pattern) resembles the same structure as the standard foration but reversed. The Inverse Head and Shoulders is observable in a downtrend (see image below) and indicates a reversal of a downtrend as higher lows are created.


There is a general rule of thumb to designate stop and limit levels. Taking the high point off the ‘right shoulder’ will specify the stop level whilst the vertical distance between the neckline and high of the ‘head’ will approximate the limit distance – 1832.8 pips in this case. The risk-reward ratio on this trade is roughly 1:1.2 which is still within the DailyFX recommended risk management parameters.


Sunday, October 25, 2020

Machine Learning

                                               How to start:

1. Analyze the Train Data completely :

  1. Skewness : https://www.kaggle.com/getting-started/110134 
  2. Null values
  3. types of data or values

SMOTE: https://imbalanced-learn.readthedocs.io/en/stable/generated/imblearn.over_sampling.SMOTE.html 

Where available, you should select among these using the average parameter.

  • "macro" simply calculates the mean of the binary metrics, giving equal weight to each class. In problems where infrequent classes are nonetheless important, macro-averaging may be a means of highlighting their performance. On the other hand, the assumption that all classes are equally important is often untrue, such that macro-averaging will over-emphasize the typically low performance on an infrequent class.

  • "weighted" accounts for class imbalance by computing the average of binary metrics in which each class’s score is weighted by its presence in the true data sample.

  • "micro" gives each sample-class pair an equal contribution to the overall metric (except as a result of sample-weight). Rather than summing the metric per class, this sums the dividends and divisors that make up the per-class metrics to calculate an overall quotient. Micro-averaging may be preferred in multilabel settings, including multiclass classification where a majority class is to be ignored.

  • "samples" applies only to multilabel problems. It does not calculate a per-class measure, instead calculating the metric over the true and predicted classes for each sample in the evaluation data, and returning their (sample_weight-weighted) average.

  • Selecting average=None will return an array with the score for each class.

While multiclass data is provided to the metric, like binary targets, as an array of class labels, multilabel data is specified as an indicator matrix, in which cell [i, j] has value 1 if sample i has label j and value 0 otherwise.


How to handle Multicollinearity

 : https://www.analyticsvidhya.com/blog/2020/03/what-is-multicollinearity/ 


To be checked: https://scikit-learn.org/stable/auto_examples/ensemble/plot_adaboost_multiclass.html#sphx-glr-auto-examples-ensemble-plot-adaboost-multiclass-py

https://scikit-learn.org/stable/auto_examples/ensemble/plot_adaboost_regression.html#sphx-glr-auto-examples-ensemble-plot-adaboost-regression-py


Monday, October 19, 2020

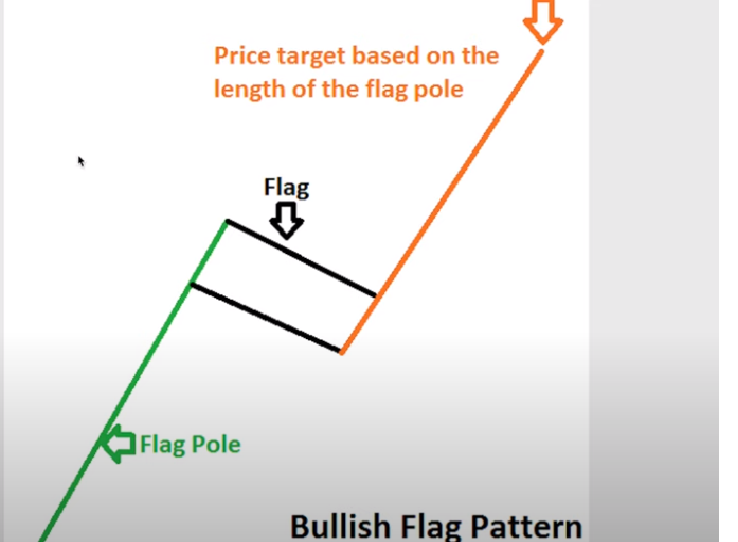
Strategy 4: Bullish Flag Pattern


                                        Bullish Flag Pattern


Sunday, October 18, 2020

Strategy 2: V shape

                                             V shape Strategy 


As the name implies, the "V" chart patterns have the letter "V" shape and prices shift their momentum from an aggressive sell-off to aggressive rally in its structure. 


The key factors of the pattern identification:

1. Sharp Downtrend
2. Sharp Uptrend
3. V shaped Pattern (usually 1-3 bars reversals)
4. Volume increase in both breakdown and breakout phases
5. Breakout over neckline
6. Pullback to the Neckline
7. Target

Stop loss: The stop loss is placed under the last lowest one

How to Do Option Chain Analysis

                                         OPTION Chain Analysis


NSE LINK:

Old Link:

 https://www1.nseindia.com/live_market/dynaContent/live_watch/option_chain/optionKeys.jsp?symbolCode=-10006&symbol=NIFTY&symbol=NIFTY&instrument=-&date=-&segmentLink=17&symbolCount=2&segmentLink=17 

New Link:


Nifty Bank Analysis 18 oct 2020

                     NIFTY Bank Analysis

As we can see it is formed V Pattern we can see the retracement of the 5% from the Top. 

So We can short it and Target Around 22600 by Oct End. 


INTRADAY: strategy 1

 Today will see the intraday simple strategy it is mostly 90% looks good for me, but need to do the RND


  1. 2 Min/ 1 Min strategy ( time frame)
  2. BUY Signal
    1. PRICE is Uptrend 
    2. 20day EMA is UP
    3. 200 day EMA is up 

Example: 
Nifty:


3. SELL Signal:

  • 200 day EMA is Down.
  • 20 day EMA is down
  • Price is down

Example Nifty


Saturday, October 17, 2020

CandleSticks Basic

 Type of Candle stick:


  1. Bullish
  1. Bearish


  2. DOJI: The Doji is an excellent potential reversal signal. It occurs when the open and the close are the same. Usually, the open and the close are found in the middle of the price range.
  3. HAMMER : It is important to recognize this sing as and indication of a potential reversal When it develop in Harmonic area. 


Friday, October 16, 2020

HARMONIC PATTERNS

                                         HARMONIC PATTERNS:


Content from Below Book: 

BOOK: The Harmonic Trader  

--------------------------------------------------------------------------------------------------------------------------------

  1. Everyone knows that October historically has been a troubling month for the major markets.
  2. particularly evident when several harmonic calculations converge at a specific price area to define critical support or resistance. This area is known as the Potential Reversal Zone.
  3. The Key to utilizing these harmonic measures when analyzing a price chart is to determine the area where the greatest amount of calculated rations congregate.
  4. When three, four or even five numbers come together within a specific area as defined by their respective structure, you must respect the high probability for some type of reversal.


                                                                    RULES

  • Bigger the Pattern, the more significant the potential reversal ( Example : Weekly chart)
  • If a PRZ contains four or five numbers, the area should be considered  very harmonic. If the price action reverse from this area, the PRZ could be considered as an important turning point. BUT if the price action doesn't reverse it worked indicate that the predominant trend is quite strong. 
  • To determine valid reversals and to optimize trade executions. These skills require consistent dedication to research past harmonic examples and to analyze current set-ups.
  • Price Gap in the PRZ occurs most frequently and is the strongest of all the warning signals. A price gap is an extremely significant indicator of an invalid setup and has kept me out of my bad trade


Saturday, October 10, 2020

INTRADAY RULES for Stocks

                                                 INTRADAY RULES for Stocks


I have divided the level in three categories L1/L2/L3. it is up to you what you think in Which Level. 
What I have felt in my journey  on the Trading sessions I have kept it here. 


IMPORTANT LINKS:


                      =========BEGNIEERS ( L1)============


  1. NO BTST ( Buy Today and Sell Tomorrow or vice versa) 
  2. NO HYPOTHESIS/ ASSUMPTION 
  3. TRADE WITH ONLY 1 lot in OPTIONS
  4. Don't go 1st with the Target after, taking the Entry first set the Stop loss. do the Trailing Stop loss. 
  5. Target for the Minimum  500/1000 per day.
  6. Stick on the Trendlines and Strategies 
STRATEGY:


                      =========INTERMEDIATE (L2)============


                      =========EXPERTS (L3) ============


                                Entry Exit when the W Pattern  seen


Above diagram we can see the W pattern Making so Making the Entry when we see the upward Move. 

Keeping the Target Minimum of  Middle of the W . Later keep the Trailing Stop Loss

Friday, September 25, 2020

                                             Trading Strategy 

1. Step trend line then book profits.

2. Shadow trend line is to go reverse.


Sunday, February 17, 2019

IR (Information Retrieval ) 2nd SEM

QUIZ

1.Proximity operators are less efficient computationally because the index needs to store positional information.
Select one:
Given the query sa*t , if you want to search for permuterm wildcard index, which of the following keys can be looked upon?
Select one:
Consider an index for 1 million documents each having a length of 1,000 words. Say there are 100K distinct terms in total. What is the space requirement for an uncompressed term-document incidence matrix considering 1 cell takes 1 bit?
Select one:
Given a document collection which has 35 relevant documents, if an IR system retrieves 10 relevant and 13 irrelevant documents, what is the recall value of the system?

Select one:
Consider the following documents, 
Doc1: Data analysis deals with data sets
Doc2: Data mining in various fields
Doc3: Data analysis techniques and algorithms
Doc4: Data sets with temporal attributes
When the Term Document incidence matrix is constructed and the query data AND (sets  OR analysis) is executed on it, the resultant doc's retrieved will be which ones from the following?
Select one:
Which of the following type of web pages can satisfy the informational query search of a user?

Select one:
Given the Boolean Query (Brutus OR Caesar) AND Mary, which of following is optimised one of the above given query?
Select one:
The OR operator assigns a higher score to documents that contain both terms.
Select one:
Which search engine is well supported with multiple languages?

Select one:
Using the Porter’s algorithm, which of the following pairs cannot be mapped together?
Select one:
Consider the following documents,
Doc1: Data analysis deals with data sets
Doc2: Data mining in various fields
Doc3: Data analysis techniques and algorithms
Doc4: Data sets with temporal attributes
When the Term Document incidence matrix is constructed for the above documents, what will be the total number of entries in the matrix?
Select one:

Monday, December 10, 2018

Data structure SS ZG 519 Information

1st SEM Data Structure SS ZG 519 paper


Text Book(s)
T1
Algorithms Design: Foundations, Analysis and Internet Examples Michael T. Goodrich, Roberto Tamassia, 2006, Wiley (Students Edition)

Reference Book(s) & other resources
R1
Data Structures, Algorithms and Applications in C++, Sartaj Sahni, Second Ed, 2005, Universities Press
R2
Introduction to Algorithms, TH Cormen, CE Leiserson, RL Rivest, C Stein, Third Ed, 2009, PHI


NOTES:

Link for notes
Previous year papers and solutions:
Data Structure SS ZG 519 paper 1

Data Structure SS ZG 519 paper 2

MTECH (WILP) BITS pilani

Basic Information for the M.Tech (WILP) with BITS Pilani

I have chosen the Software System. First you have apply to the BITS portal (https://wilpadmissions.bits-pilani.ac.in/ )

For More details you can download the Brochure :https://bits-pilani-wilp.ac.in/m-tech/software-systems.php#downloadbrochuremodal 

Once you got the username and password after BITS accepted your application.
you can login to the portal and access the information.

Some Basic Points:

  1. Online class, no offline class.
  2. Only you have to give exams offline, that is you have to go to the center and write the exams. Exams will be paper and pen not objectives.
  3. Quiz will be online mode
  4. Assignment you can prepare and submit to the portal.
  5. you can join class and access the pre recorded videos on mobile/Laptop/Tablet etc.
  6. Mobile apps you can download it from (https://play.google.com/store/apps/details?id=com.moodle.moodlemobile&hl=en) App name is moodle.
  7. BITS have concept of comprehensive and Makeup. if suppose you missed the comprehensive Exam you can give the Makeup. But if you missed both then you are FAIL. no other options.

Friday, April 7, 2017

Android Crash analysis tips

                    CRASH Analysis

Crash(Analyze linux crash dump data or a live system) and gdb are both interactive tools, where the user by using a command line interface can analyze
the crash in much more details.

Trace 32(Lautherbach) is a hardware debugger used primary on modified phones and breakout boards.

readelf and addr2line are standard linux tools to examine elf files, e.g. read symbolic informatiion or finding the corresponding
source code giving a PC (program counter) value.


BugReport:
1. It is normally stored on the SD-card (/sdcard/BugReport/BugReport-<IMEI>-date&time.gz
2. log file requires 250KB+ free space.
3. "adb bugreport" can be used to generate the bugreport.
4. chkBugReport is a tool that does some parsing and visualization for the bugreports.(https://github.com/sonyxperiadev/ChkBugReport)
    4.1. it will generate a PDF and contain following info: errros,vm traces, system and event log, Ftrace, Battery history, CPU freq, SurfaceFlinger.
    4.2. It contains all process and thier stack traces at the point of saveing the bugreport.
         it also does some simple main thread violation check.
    4.3. Also, if there is a deadlock between the thread(circular dependency/waiting), that will be reported as well.
    4.4. Event log extracts the log generated by the ActivityManager (am_*) and plots a chart showing the running activities and services
    4.5. Crash Info page tries to show all relevent information that can be found in vmcore file(eg. if carash notes information about current process,
         crash register is available)


Find the source (line number where crash happen)
addr2line -e bluetooth.default.so 0x8200345a --> btif_config.c:144
using abouve command line tool (addr2line) we can find the corresponding source code line, in this case line 144 in btif_config.c

from the log we will the address 0x8200345a in program counter
NOTE: we need the same execuitable/.so file where the crash happen.


Android log files can view using the following commands:
1. adblog -m (main)
2. adblog -s (system)
3. adblog -e (event)
4. adblog -r (radio)


Qualcomm Short Term

  113 is the SL. 1st Target by mid July.

Total Pageviews